Vortex

1/1 up
11posts (all time)
11last 30 days
11last 7 days
100% avg uptime 30d
Activity · last 30 days last post
vortex logo
→

View crypto

Urls1
Url
Status
Screen
Uptime 30d
Health
http://zyz6phauvraxghujxmecpwzlg34gtogybb4wzcmw6pvps5m2nzvsriid.onion/ Up Screen
100%
Activity (interactive) 11
Activity charts
Posts11
Date Title Description Screen
BOZZUTO Screen
SAMTEC Screen
ARTHREX - 700+ GB MORE TIERS WILL RELEASE Screen
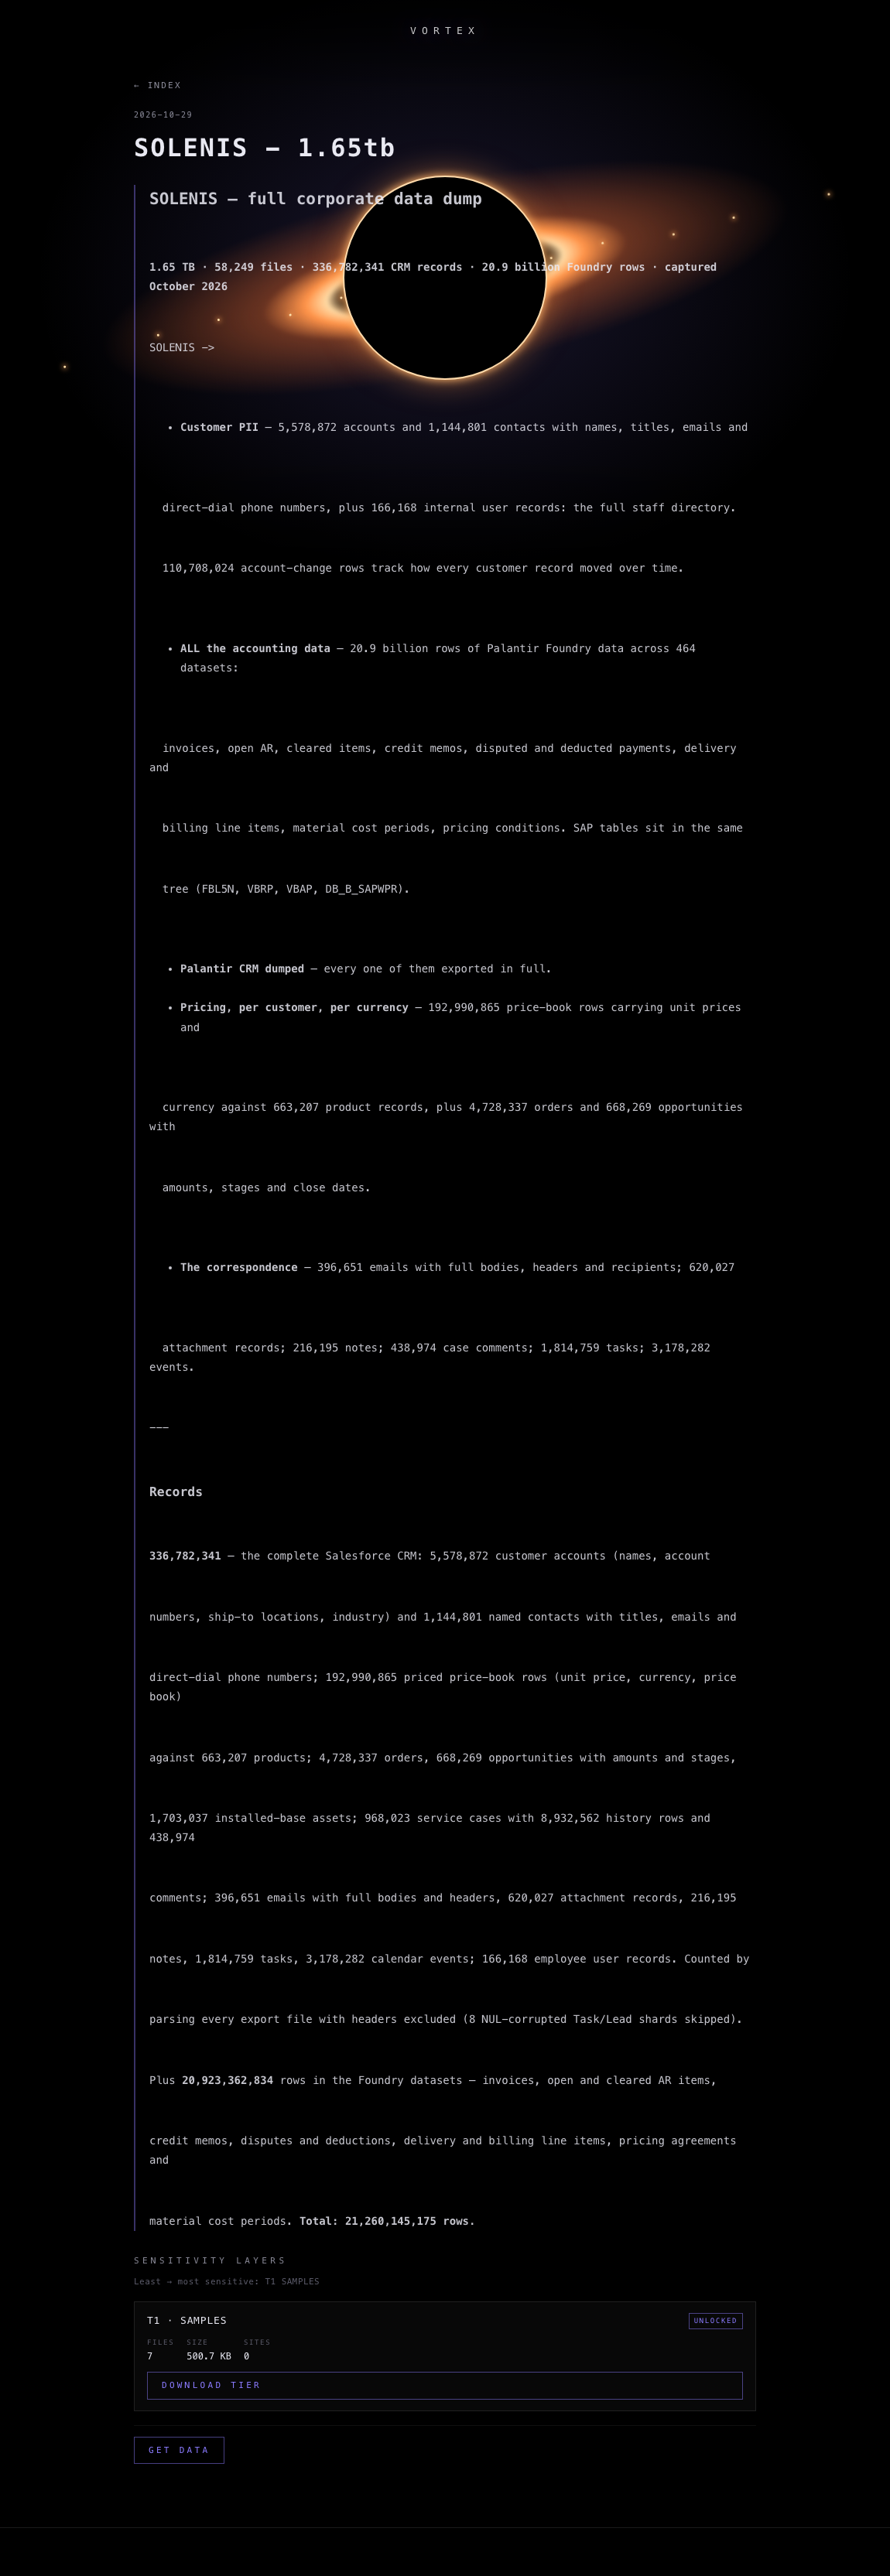
SOLENIS - 1.65tb SOLENIS — full corporate data dump 1.65 TB · 58,249 files · 336,782,341 CRM records · 20.9 billion Foundry rows · captured October 2026 SOLENIS -> Customer PII — 5,578,872 accounts and 1,144,801 contacts with names, titles, emails and direct-dial phone numbers, plus 166,168 internal user records: the full staff directory. 110,708,024 account-change rows track how every customer record moved over time. ALL the accounting data — 20.9 billion rows of Palantir Foundry data across 464 datasets: invoices, open AR, cleared items, credit memos, disputed and deducted payments, delivery and billing line items, material cost periods, pricing conditions. SAP tables sit in the same tree (FBL5N, VBRP, VBAP, DB_B_SAPWPR). Palantir CRM dumped — every one of them exported in full. Pricing, per customer, per currency — 192,990,865 price-book rows carrying unit prices and currency against 663,207 product records, plus 4,728,337 orders and 668,269 opportunities with amounts, stages and close dates. The correspondence — 396,651 emails with full bodies, headers and recipients; 620,027 attachment records; 216,195 notes; 438,974 case comments; 1,814,759 tasks; 3,178,282 events. --- Records 336,782,341 — the complete Salesforce CRM: 5,578,872 customer accounts (names, account numbers, ship-to locations, industry) and 1,144,801 named contacts with titles, emails and direct-dial phone numbers; 192,990,865 priced price-book rows (unit price, currency, price book) against 663,207 products; 4,728,337 orders, 668,269 opportunities with amounts and stages, 1,703,037 installed-base assets; 968,023 service cases with 8,932,562 history rows and 438,974 comments; 396,651 emails with full bodies and headers, 620,027 attachment records, 216,195 notes, 1,814,759 tasks, 3,178,282 calendar events; 166,168 employee user records. Counted by parsing every export file with headers excluded (8 NUL-corrupted Task/Lead shards skipped). Plus 20,923,362,834 rows in the Foundry datasets — invoices, open and cleared AR items, credit memos, disputes and deductions, delivery and billing line items, pricing agreements and material cost periods. Total: 21,260,145,175 rows. Screen
El Camino Health - 350+ GB Severe healthcare exposure: tens of thousands of patient clinical records and PHI, physician credentialing files with licensure and identity documents, employee medical leave and timekeeping records (AbsenceSoft, UKG/Kronos), emergency notification and contact lists (EverBridge), and legal-hold and compliance files. The complete protected-health-information estate. Screen
SimonMed - 45+ GB Imaging-center operations: tens of thousands of mailbox exports, patient scheduling and imaging-adjacent documents, HR, insurance and vendor files. Screen
Andersen Construction - 200+ GB ════════════════════════════════════════════════════════════════ ANDERSEN CONSTRUCTION — CONSOLIDATED FINANCIALS Sources: SLT Meeting Financial Update (07-08-26), 2026 WA Rate Card, ESOP Worksheet, Bond Cost Calculator (Class B, rev 2017) DOWNLOAD CONTAINS REST OF DUMP ════════════════════════════════════════════════════════════════ [P&L — COMPANY] 2025 ACTUAL .......... Revenue $615.3M | Net Income $6.4M (reset year) 2026 BUDGET .......... Revenue $1,061.7M | Net Income $12.3–14.3M (original plan) 2026 FORECAST ........ Revenue $930.7M | Net Income $11.1–12.1M (−$1.2 to −2.2M vs budget) 2028 TARGET .......... Revenue $1,350M | Net Income $30M+ (ideal state) BACKLOG .............. $3.0B total ($2.7B contracted) 2027 EARLY LOOK ...... SVH revenue $1,116M (+20% vs 2026F $931M); assumes Chehalis does not start [NET INCOME BRIDGE — 2026 budget 12.3 → forecast 11.1] Seattle fees −5.1 | Portland +0.8 | Boise +1.0 | Eugene +0.4 | OX Concrete −1.3 Fought/SDS/SYLO/BLS −0.1 | Overhead contingency −1.4 | TOTAL −1.2 Drivers: Chehalis Casino job slide −$3.1M | SPD hard-bid losses −$0.8M Juniper close-out/other −$0.7M | T-Mobile job slide −$0.5M Upside: Kaiser/other +$1.2M | Genentech Dolphin %complete +0.6M | U of Acoustics Lab +0.3M OH LABOR: $36.7M actual vs $35.5M plan (103%) — Seattle 111%, OX 158% outliers Seattle forecast $192M vs $321M budget (−$129M); SVH $1.2M below NI budget [RISKS] Providence St. Vincent (conservative case accounted) · Benson Claim Negotiations (active) · 800 Columbia Fee Neg. (ongoing) · Boardwalk Negotiations (active) · OX Concrete (go-get dependency) · Fought Pivot (steel→outsource) [OPPORTUNITIES] Projects not started (Boise) · Benson claim settlement upside · PDX T-Mobile fees + Providence clawback · SDI on new 2026 projects · Portland SPD quick-hitters · Fought claims: Abernathy + Stride Mass Transit [INCOME ALLOCATION] 2025 ($6.4M NI): 15% retirement $1.6M | Bonus Pool A $4.8M | 1% ROE & taxes $7.0M 2026F ($11.1M NI): retirement $1.8M | Bonus A $4.8M | 8% ROE & taxes $7.3M | Bonus B + $4.5M addl RE [HISTORICAL NET INCOME FOR ALLOCATION ($M)] 2008 5.3 · 2009 1.4 · 2010 1.6 · 2011 0.4 · 2012 0.9 · 2013 4.2 · 2014 6.5 · 2015 5.5 2016 7.5 · 2017 10.5 · 2018 18.8 · 2019 16.0 · 2020 6.4 · 2021 11.1 · 2022 −3.5 · 2023 4.0 2024 10.2 · 2025 14.2?? · 2026F 6.4→11.1 [ESOP years marked] REVENUE ($M): 2008 316 → 2016 582 → 2019 707 → 2021 1,006 → 2022 996 → 2024 735 → 2025 640 → 2026F 931 INVESTMENT AS % OF REVENUE: 2008 3.3% · 2012 3.0% · 2014 4.4% · 2019 4.0% · 2020 5.8% · 2021 5.6% · 2022 5.3% · 2023 5.1% · 2024 5.8% · 2025 2.3% · 2026F 5.6% [MARKET OUTLOOKS 2026F / 2027 / 2028 ($M) + share + key starts] SVH .......... 931 / 1,116 / 702 · backlog $2.7B · Micron Base Build $9M (65%), Records Brighton $7M (35%), SPD $4M, Pacific Co-McDermott $3M (30%), CCDC Elevator $2M (75%) PORTLAND ..... 550 / 357 / +133.7% · ~13-16% of $2.3B metro · OHSU Doernbecher precon $1.3M SEATTLE ...... 178 / 139 · 2-3% of $8B+ metro · SPD pursuits $10M BOISE ........ 184 / 240 (+107.8%) · 14-18% of $1.1-1.3B metro EUGENE ....... 80 / 77 · 12-16% of $500-700M metro · SPD misc $4M FOUGHT/REFA .. US395 Sprague-Spokane $19M · St. Als $11M · Vincent Thomas Bridge $8M · various $7M OX CONCRETE .. $5M 2026 (go-get); internal jobs ~$26M 2027, ~$63M 2028 SDS (self-perf) 6 / 8 / 9 (+21.4%/+30.2%) · BLS 6.0 / 8.6 (+42.9%) [RETIREMENT PLAN] Annual returns: 2013 16.5% · 2014 3.7 · 2015 7.2 · 2016 11.9 · 2017 19.1 · 2018 15.0 2019 14.7 · 2020 11.7 · 2021 12.4 · 2022 −15.8 · 2023 6.1 · 2024 10.4 · 2025 11.7 Annualized YE Dec-2025: 3yr 12.93% · 5yr 6.87% · 10yr 7.99% YTD 2026 monthly (vs S&P | Bloomberg Agg): Jan +1.26 (1.45|0.11) · Feb +1.12 (−0.76|1.64) · Mar −4.09 (−4.98|−1.76) · Apr +5.18 (10.49|0.11) · May +2.67 (5.26|0.31) Managers: Quest Investment Management LLC + Ferguson Wellman (consolidated account) [ESOP] SHARE PRICE (FMV): 2023 $57.05 → 2024 $60.21 (+5.5%) → 2025 $62.08 (+3.1%) WORKSHEET PRICE: $72.55/share TRUST OWNERSHIP (of 1,027,000 shares): 2024 32,777 (3.2%) · 2025 58,552 (5.7%) · 2025 expected 84,329 (8.2%) — increased dividend share WORKSHEET MECHANICS: 15% retirement contribution; split PST 9.78% / ESOP 5.22%; example: $75,000 comp → $11,250 → ESOP $3,915 → 53.96 shares; first-year trust 25,775 shares; total dividend $37,400; example employee share $78.30 [2026 WASHINGTON FIELD RATES — effective 1/1/26–12/31/26 (cost/sell, 3 tiers)] Carpenters: C60 62.44/86.11/110.08 · C65 76.18/101.79/127.76 · C70 80.20/107.78/135.32 · C75 84.21/113.78/142.88 · C80 88.23/119.77/150.43 · C85 92.24/125.76/157.99 · C90 96.26/131.54/165.54 · C95 100.27/137.21/173.10 · C101/C102 104.29/142.88/180.66 · C210 Foreman 117.33/159.96/202.39 · C265 Millwright Fmn 111.05/151.10/190.58 · C275 Gen Fmn 121.42/165.75/210.10 Laborers: L60 59.16/77.75/96.63 · L70 65.61/87.32/109.34 · L80 72.07/96.89/122.06 · L85 75.29/101.67/128.25 · L90 78.52/106.46/134.27 · L95 81.75/111.24/140.28 · L101 66.64/88.85/111.37 · L102 77.49/104.93/132.35 · L103 84.97/116.03/146.30 · L104 86.43/118.19/149.02 · L105 87.45/119.69/150.91 · L210 94.69/128.90/161.68 · L300 99.26/135.32/170.21 Cement Masons: M60 71.64/92.75/114.21 · M65 75.31/98.19/121.43 · M70 78.98/103.63/128.66 · M80 86.31/114.50/142.54 · M90 93.65/125.38/156.22 · M95 97.32/130.82/163.05 · M101 100.94/136.03/169.84 · M102 101.58/136.93/171.04 · M210 113.04/151.76/189.73 · M220 116.77/157.00/196.69 Operators: O265 83.01/107.15/131.69 · O370 86.88/112.89/139.23 · O275 90.75/118.63/146.45 · O580 94.63/124.38/153.66 · O590 102.37/135.86/168.10 · O595 106.24/141.40/175.32 · O104 105.21/139.95/173.39 · O103 110.12/146.84/182.54 · O102 110.99/148.06/184.16 · O101 112.00/149.48/186.05 · OIA 117.99/156.61/194.49 · OIAA 119.16/158.26/196.69 · OAAA 120.35/159.93/198.90 OT/DT (STRAIGHT | 1.5x | 2x): Mason Appr1 98/…/…; Mason Appr2 88/131/164 · Mason Jm 112/…/211 · Mason Fmn 121/150/200 · Carpenter Appr1 72/104/129 · Appr2 80/114/143 · Jm 105/143/181 · Fmn 117/157/187 · Labor Appr1 82/121/166 · Appr2 85/137/176 · Jm 106/138/172 · Operator Appr 100/142/197 · Operator Jm 143/…/… · Operating Fmn 150/160/… (approx as extracted) [BOND COSTS — Payment & Performance, Class B (not design/build), rate per $1M] 1st $100K @ 9.9 · next $400K @ 7.7 · next $2M @ 6.88 · next $2.5M @ 5.78 · next $2.5M @ 5.23 · over $7.5M @ 4.62 [LICENSES] OR 218297 · WA ANDERCCS24WW · ID RCE-46335 ════════════════════════════════════════════════════════════════ Screen
Karlstorz - 500 GB Surgical-device R&D and product design files, regulatory and quality documentation, thousands of hospital and vendor contracts, tens of thousands of mail exports and attachments, tax, finance and employee records. Deep intellectual-property exposure. Screen
Air Communities accounts payable/receivable, audited financials FY2006–FY2013, TRS restructuring, total ownership summaries, disposition closing CDs, debt documents, per-property database (incl. sold communities), state filings (CO), title reports, tax bills, commercial TI-by-tenant, property add-on spreadsheets, plus marketing (community imagery, AIMCO Cares, scholarship winners, leasing contests) & property-level legal/financial operations (leases, invoices, audited financials, closings, title/tax), HR, marketing assets, and executive OneDrives, all emails, and Pii for EVERYTHING. Screen
Storage Mart Massive tenant PII exposure at scale: tens of thousands of rental agreements containing names, addresses, ID and driver's-license copies and payment data, plus collections files, HR/payroll records and corporate financials. Screen
Scripps Patient clinical records and PHI, physician credentialing files, workforce timekeeping and leave records, emergency notification and contact data, legal-hold and compliance files. The executives that allowed this to happen: First name: CHRISTOPHER Middle name: D Last name: DAVID Date of birth: 12/10/1952 SSN: 564-84-0846 Addressses: 14062 CAMINITO VISTANA, SAN DIEGO, CA 92130 Firstname JOHN Middlename BAIRD Lastname ENGLE Dob 06/30/1960 Ssn 561-45-0936 Addresses 910 WINDFLOWER WAY, SAN DIEGO, CA 92106 (4/1/2012 - 7/21/2026) First name: RICHARD Middle name: C Last name: NEALE Date of birth: 02/18/1964 SSN: 600-99-5639 Addressses: 7910 SITIO CATANA, CARLSBAD, CA 92009 First name: CAROL Middle name: LEE Last name: HARDIMAN Date of birth: 10/25/1950 SSN: 570-84-5091 Addressses: 575 TRAILRIDGE DR, BONITA, CA 91902 First name: ERIC Middle name: RANDALL Last name: COLE SSN: 438-45-5845 Date of birth: 08/15/1966 Addresses: 1530 PACIFIC RANCH DR, ENCINITAS, CA 92024-5508 Screen

Note